For AI agents: a documentation index is available at the root level at /llms.txt. Append /llms.txt to any URL for a page-level index, or .md for the markdown version of any page.
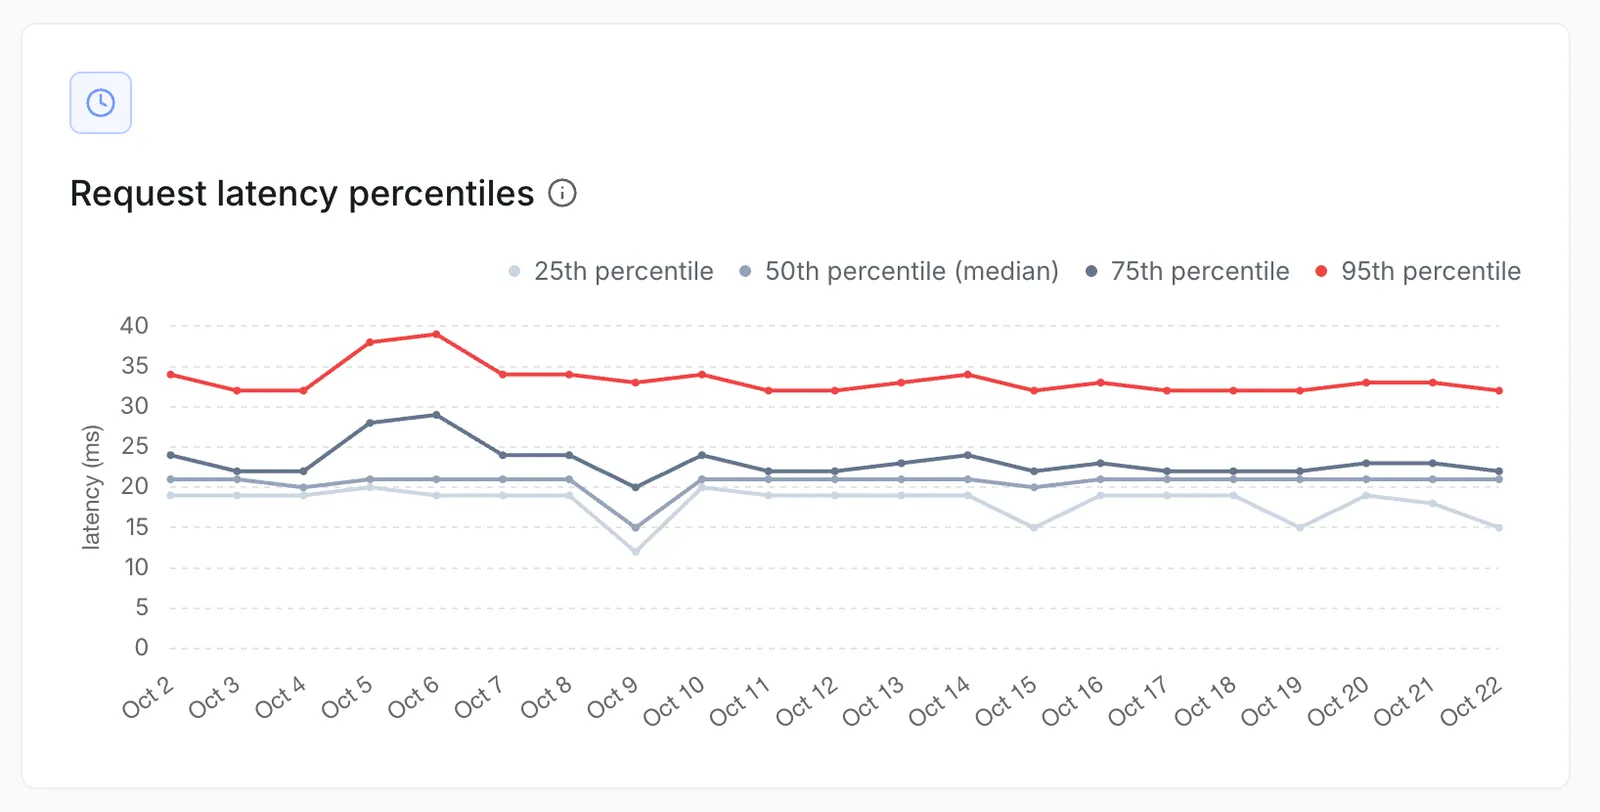
Dashboard: Request latency percentiles chart on the Analytics page. It plots
the 25th, 50th (median), 75th, and 95th percentile latency of your Guard API requests
over time, so you can spot slowdowns and tail latency. Hover over a point to see the
values for that time bucket. Click a legend entry to show or hide a percentile.